Tools for Distributed Tracing
Introduction
In the previous blog post, the discussion centered around the idea of linking and tracing requests across multiple services in a distributed architecture. This is to eventually assist in troubleshooting and optimizing the overall performance of the entire distributed application stack. There are several distributed Tracing Tools available to help in this regard. These tools collect and export telemetry data and some also in visualizing the flow of requests across various services, identifying bottlenecks, and troubleshooting issues.
Tooling
Industry best practices dictate three basic steps to be completed in order to adopt distributed tracing for a given application stack.
-
Code Instrumentation
-
Collecting and Exporting Telemetry Data
-
Analysis and Visualization
Code Instrumentation
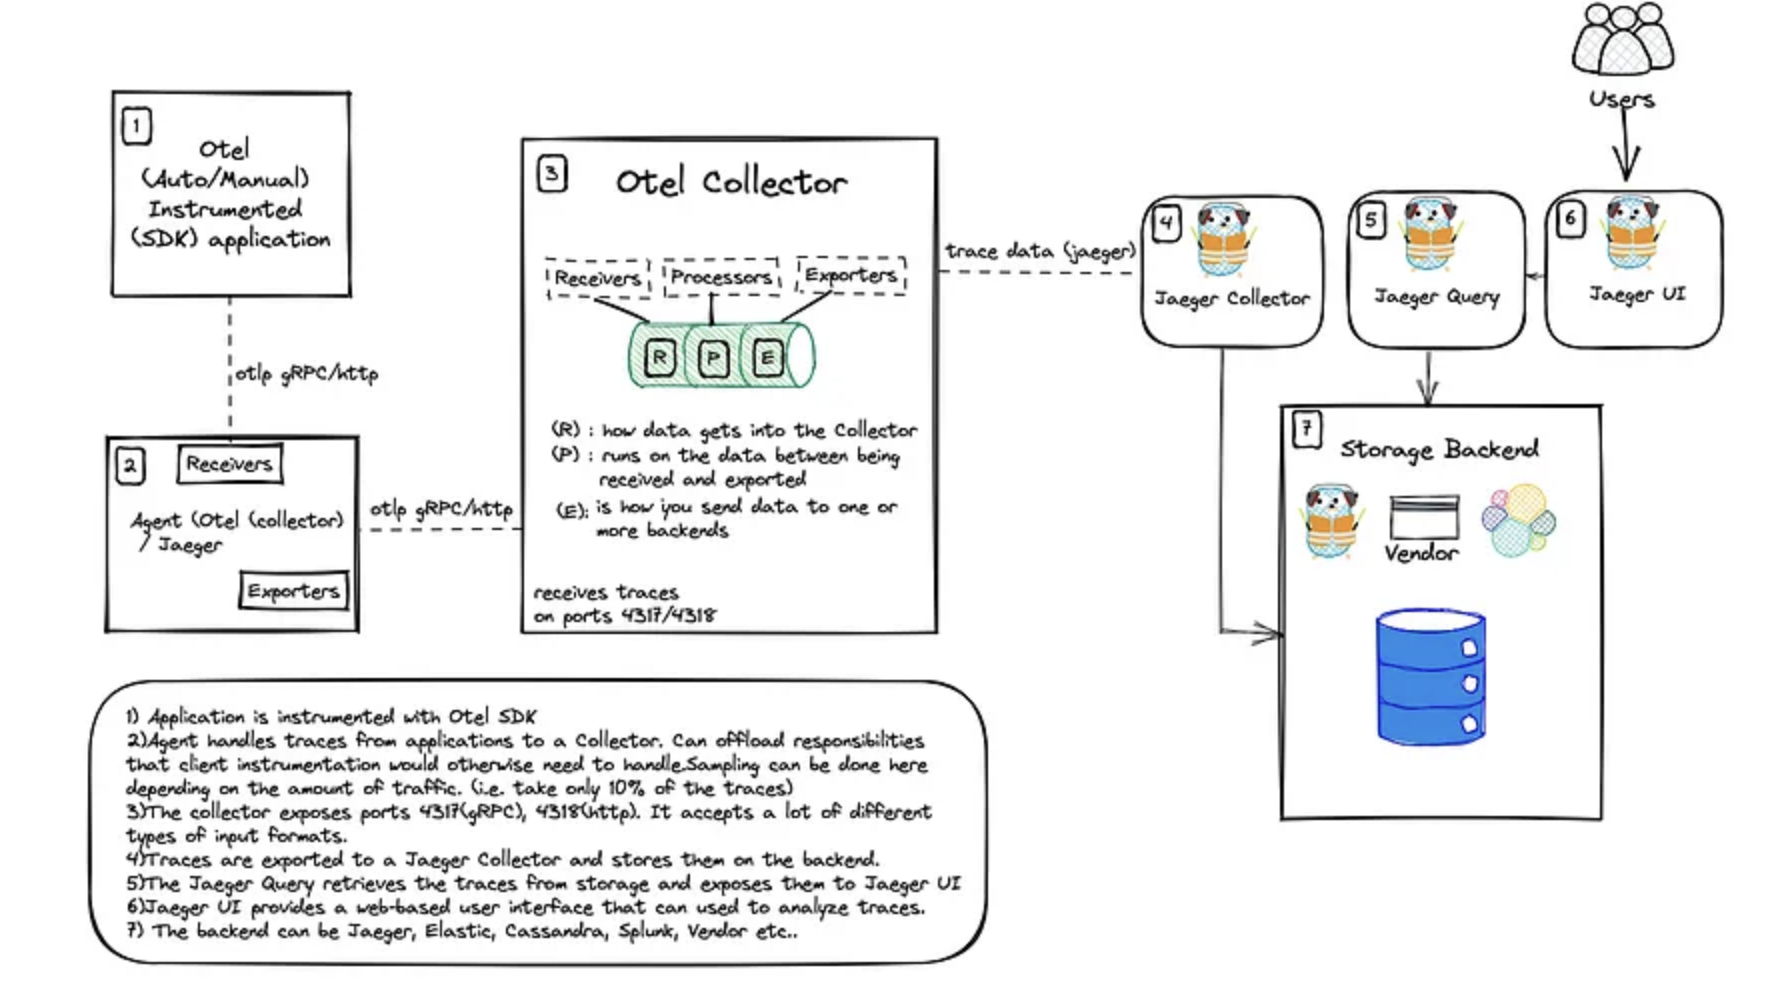
Code Instrumentation is the process of enabling the application code to emit traces (roe recording). Instrumentation can be automatic or manual depending on a variety of factors. Most modern tracing tools support automatic instrumentation, which capture telemetry data by essentially watching certain processes to be invoked in the tools and frameworks that make up any application. When they are invoked, the instrumentation mechanism automatically starts to collect and export trace spans on behalf of the application.
Some tools that offer automatic instrumentation include the OpenTelemetry Suite, AppDynamics, Datadog to name a few. These tools support libraries, agents, and/or integrations that automatically instrument applications, making it easier for organizations to adopt distributed tracing and observability practices.
Collecting and Exporting Telemetry Data
OpenTelemetry collector is the de facto vendor agnostic agent implementation for collecting and export trace data to various open source and commercial backends. You can install an OptenTeleletry collector as an agent and configure various exporters such as datadog exporter, which allows you to forward traces on to Datadog without an agent. With open telemetry API & SDKs, you can integrate observability code directly into your application (manual instrumentation) and export data to your preferred exporter directly without a collector agent.
Visualization & Analysis
Once trace or telemetry data is collected, it will need to be exported to a backend that supports visualization of such data. Some of the most popular open source tools used for this purpose include Zipkin, Jaeger and Grafana/Tempo. These tools can be paired with OpenTelemetry, which is the industry-standard open source platform for instrumentation and data collection. Tools such as DataDog and New Relic also provide their own auto-instrumentation libraries to collect data and export it to their custom visualization platform.
Conclusion
There are many tools available that provide centralized monitoring, analysis, and visualization of trace and telemetry data. Dynamic tracing capabilities and support for various libraries and languages make these tools adaptable to dynamic and diverse application stacks. However, it’s up to each organization to select the appropriate tools, factoring in cost, scale, complexity along with ease of use for a given application stack.