Azure Infrastructure and Application Performance Monitoring
Introduction
Monitoring the infrastructure and applications running in Azure is critical to maintaining the overall health, performance, and security posture of an application. Effective monitoring provides insights into applications performance as well as proactively identifies issues impacting application components and the resources they depend on.
Azure Monitor
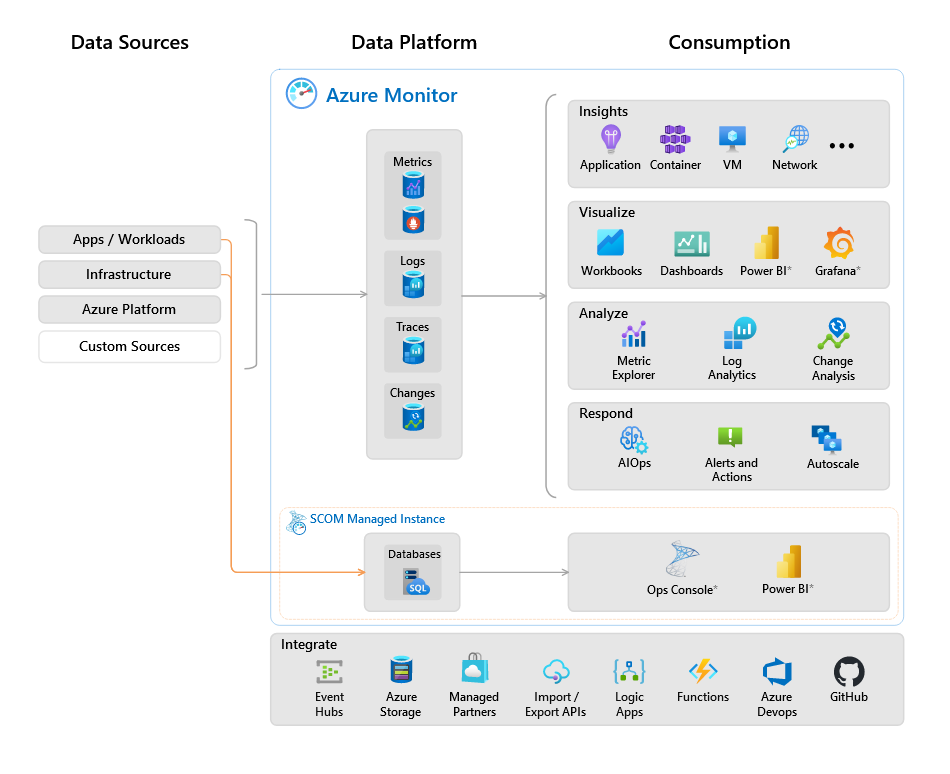
Azure Monitor is a service in Azure that provides a comprehensive solution for collecting, analyzing, and acting on telemetry from the underlying cloud environment. It assists in understanding the performance of the infrastructure and applications and assists with proactively identifying issues affecting them.
Key Features of Azure Monitor
-
Application Insights : It is an Application Performance Management (APM) service for developers and DevOps professionals. Application Insights can be used to monitor live applications, detect performance anomalies, and to diagnose issues and understand what users actually do within the application.
-
Log Analytics : Azure Monitor Logs is a feature of Azure Monitor that collects and organizes log and performance data from monitored resources. It assists with log analysis by supporting a query language to quickly retrieve, consolidate, and review collected data.
-
Azure Monitor for Containers : This service monitors the performance of container workloads deployed to managed Kubernetes clusters hosted on Azure Kubernetes Service (AKS). It provides performance visibility by collecting memory and processor metrics from controllers, nodes, and containers.
-
Azure Monitor for VMs : This service monitors Azure virtual machines (VM) at scale, by analyzing the performance and health of Windows and Linux VMs as well as any related components.
Infrastructure Monitoring using Azure Monitor
Azure Monitor can be used to monitor Virtual Machines, Containers, Databases, and other cloud infrastructure resources in Azure. It also provides access to network monitoring capabilities such as Connection Monitor, flow logging for network security groups (NSGs), and Traffic Analytics and other diagnostic features.
Virtual Machines
VM monitoring in Azure can be configured at different levels such as host level, operating system, workloads or application level monitoring. It can also be configured for both Azure Virtual Machines and Azure Virtual Machine Scale Sets.
Configuring Azure Monitor is done in two basic steps:
- Deploy Azure Monitor Agent on your Virtual Machine to collect data
- Create applicable data collection rules
VM Insights can also be enabled to simplify onboarding the Azure Monitor Agent and use a predefined set of collection rules. VM Insights is an Azure Monitor feature which can be enabled for individual VMs using the Azure Portal.
Containers
Azure provides a complete set of services based on Azure Monitor for monitoring the health and performance of different layers of the Kubernetes infrastructure and the applications that run on it. Currently used monitoring tools such as Network Watcher can be used to monitor the networking components. For cluster level components, tools such as Managed Prometheus and Grafana can be used to monitor the nodes and node pools.
Additionally, Container Insights can be used to monitor the performance and health of container workloads deployed to AKS. Container Insights integration with Azure Monitor Metrics and Log Analytics Workspace makes it easier to query logs and observe metrics coming from Kubernetes components.
Database
Azure SQL Database and Azure SQL Managed Instance provide resource metrics that can be viewed in the Azure portal. Azure Monitor metrics can also be used to monitor database and elastic pool resource consumption and health. Alerts can be configured to send notifications when metric values indicate a potential problem.
Additionally, Query Performance Insight is a feature which provides query analysis for SQL Databases and SQL Servers in Azure. It helps identify the top resource consuming and long-running queries in your workload. It can be used to optimize the queries and to improve overall workload performance.
Application Performance Monitoring using Azure Monitor
Application Insights is an extension of Azure Monitor that provides Application Performance Monitoring (APM) features. APM tools are useful to monitor applications from development, through test, and into production by:
- Proactively understanding application performance as it goes through different stages of development and testing
- Reactively reviewing application execution data to determine the root cause of behind an incident
In addition to collecting metrics and application telemetry data, Application Insights can also be used to collect and store application trace logging data.
Alerting using Azure Monitor
Alerts in Azure Monitor proactively sends notifications when important conditions are found in the collected monitoring data. They facilitate identifying and addressing issues before end users actually notice them.
To create alerts, you need to:
- Create alerts based on metrics for most Azure services, and logs in Log Analytics workspace.
- Create alert rules which define the conditions and the actions to take when the conditions are met. You can configure the alert rule to send you an email, call a webhook, or start an Azure Automation runbook.
Conclusion
Monitoring is a crucial aspect of maintaining a healthy and efficient application ecosystem. Azure Monitor provides a comprehensive and flexible platform for managing, measuring, and analyzing the health, performance, and availability of applications and the underlying Azure infrastructure. The key to effective monitoring is a well-planned implementation. It is important to understand what data is available and what can be monitored before implementing a monitoring strategy.